
I saw this project by Alptekin Sunnetci on LinkedIn and wanted to try it. What drew me to this project was the cost. I was using APC temperature sensors which are close to 100 dollars, and this build cost me less than 10 dollars. So I went ahead and ordered the parts.
The project is open source and it's called netio.probe. It runs on a NodeMCU ESP8266 and reads temperature from a DS18B20 sensor. After that it exposes the value with SNMP v2c. It also has a simple web UI for configuration and status. The SNMP traps are sent when the temperature crosses the configured thresholds.
I used a DS18B20-XH adapter because it already has the pull-up on the small board. That means I didn't need a breadboard, no separate 4.7 kOhm resistor, and less tiny wiring. I also used Dupont jumper cables so the whole thing is easy to assemble and easy to take apart later. I built and uploaded everything from command line with arduino-cli.
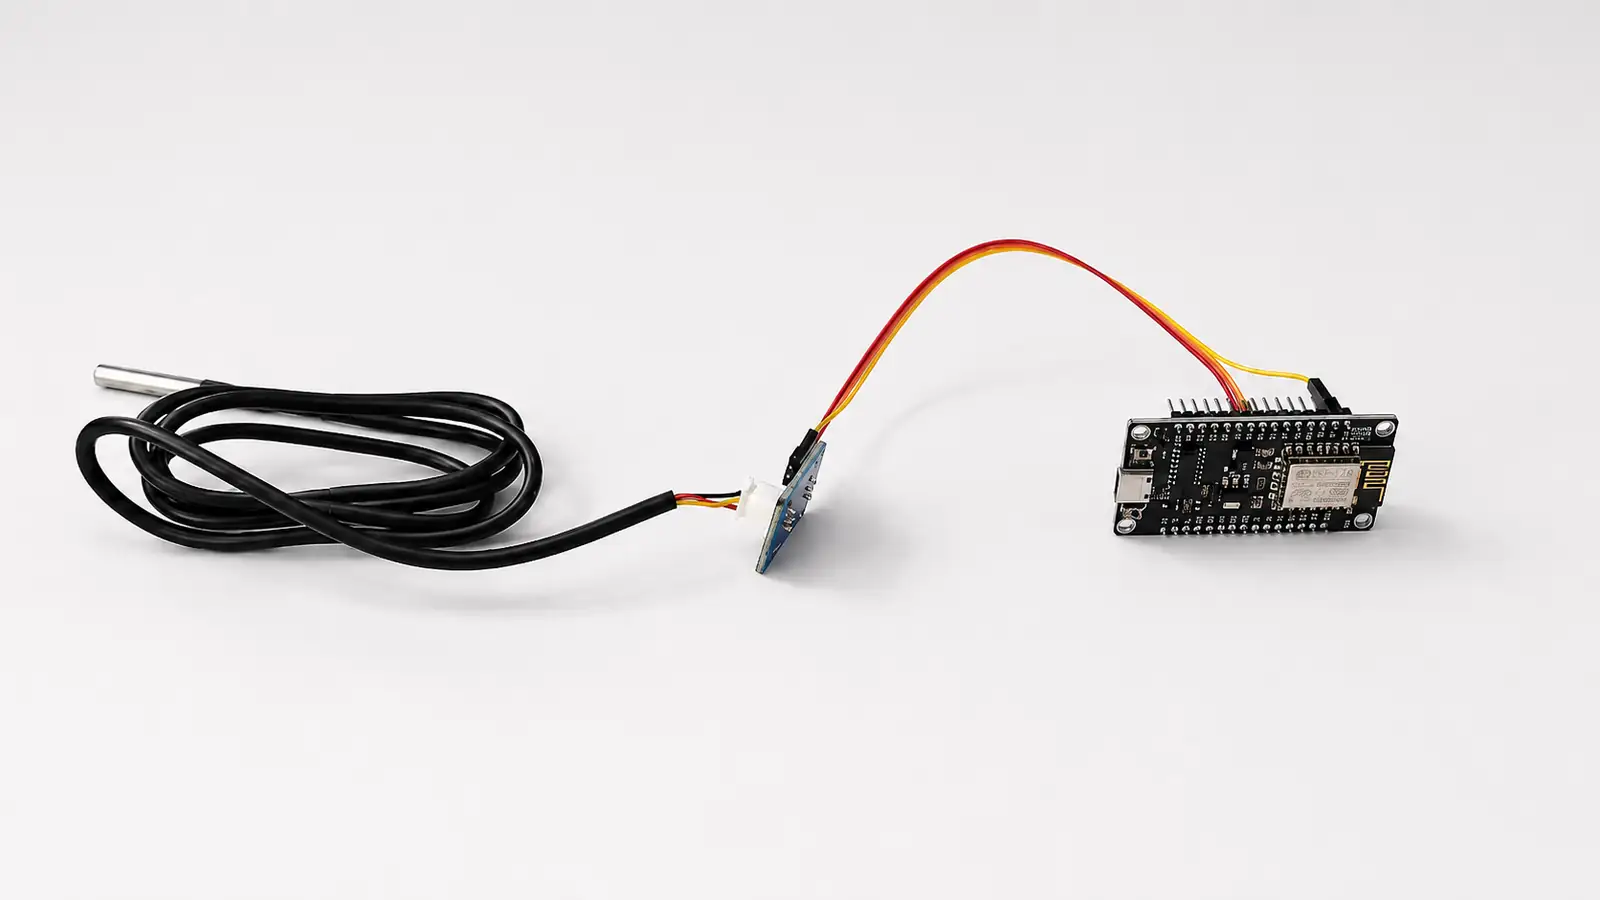
Hardware
The hardware list:
- NodeMCU ESP8266 ESP-12E board
- DS18B20-XH temperature sensor and adapter
- Dupont jumper cables
- USB cable
Wiring:
DS18B20-XH VCC -> 3V3DS18B20-XH GND -> GNDDS18B20-XH DATA -> GPIO4 (D2)The DS18B20-XH adapter has the pull-up resistor already on the module, so I did not add a separate 4.7 kOhm resistor as the repo suggests. If you use a bare DS18B20 sensor instead of the adapter, then you still need that pull-up resistor between DATA and 3V3. The ESP8266 internal pull-up is not good enough for reliable 1-Wire timing, especially when WiFi is running.
Install arduino-cli
First install arduino-cli.
On Windows:
winget install --id ArduinoSA.CLI -earduino-cli versionInstall the ESP8266 core
Arduino CLI does not know about ESP8266 boards by default, so we need to add the ESP8266 board manager URL and install the core.
arduino-cli config initarduino-cli config add board_manager.additional_urls https://arduino.esp8266.com/stable/package_esp8266com_index.jsonarduino-cli core update-indexarduino-cli core install esp8266:esp8266This download includes the toolchain, esptool, Python helpers, and all the board files.
After install, verify it with:
$ arduino-cli core listID Installed Latest Nameesp8266:esp8266 3.1.2 3.1.2 esp8266Get the source
Clone the firmware repo:
git clone https://github.com/alptekinsunnetci/netio.probe.gitFind the serial port
Plug in the NodeMCU and check which COM port Windows assigned to it. You can check in Device Manager under "Ports (COM & LPT)". It should show up as something like "USB Serial Port (COM5)". In my case the board showed up as COM5. Yours can be different. It depends on the USB-UART chip on the board. It can be CH340, CP2102, FTDI, or something else.
If no COM port appears, first check if Windows can see the device:
Get-PnpDevice -PresentOnly | Where-Object Class -eq 'Ports' | Select-Object Status, FriendlyName, InstanceIdSometimes unplugging and plugging it back is enough. If not, re-scan devices:
pnputil /scan-devicesIf it still does not show up, it is usually a USB driver problem or a bad cable. Some USB cables are only for charging, so that is worth checking too.
Compile the firmware
Compile the sketch with the NodeMCU FQBN:
arduino-cli compile --fqbn esp8266:esp8266:nodemcuv2 netio.probeUpload to the board
Upload it to the ESP8266. Change COM5 to your own port.
arduino-cli upload -p COM5 --fqbn esp8266:esp8266:nodemcuv2 netio.probeThe NodeMCU should reset itself into bootloader mode using DTR/RTS. If everything is good, upload finishes like this:
Wrote 410384 bytes (281924 compressed) ... in 24.9 secondsHash of data verified.Hard resetting via RTS pin...If upload fails, check the COM port first. Then check the cable. Then check if another serial monitor is already using the port.
First boot
Open the serial monitor at 115200 baud:
arduino-cli monitor -p COM5 -c baudrate=115200On first boot, you get this output:
=== netio.probe v1.5 (ESP8266 DS18B20 SNMP) ===Chip ID : 0x6c69acHost : netio-probe-6c69ac[CFG] Gecerli yapilandirma yok, varsayilanlar yukleniyor.[DS18B20] Pin: GPIO4 (harici pull-up)[DS18B20] Sensor algilandi (presence).=== netio.probe - WiFi Yapilandirma Portali (AP) ===AP SSID : netio.probe-69ACAP Sifre: snmpsetupPortal : http://192.168.4.1/The important line is this one:
[DS18B20] Sensor algilandi (presence).That means the ESP8266 can see the DS18B20 on the 1-Wire bus. If you do not see this, check the Dupont cable order on the adapter before looking anywhere else. It is very easy to flip VCC, GND, and DATA. The DS18B20 will not work if the wiring is wrong, and it will not show any errors on the serial output. So double-check the wiring if you do not see the "Sensor algilandi" line. I accidentally swapped 3V3 and GND on the first try, and it almost fried the sensor. Luckily I caught it early and nothing was damaged.
Configure WiFi
Connect your laptop to the WiFi network shown in the serial output. netio.probe-69AC:
Default password:
snmpsetupThen open:
http://192.168.4.1/Select your normal WiFi SSID, enter the password, and submit. The ESP8266 will reboot and join your network.
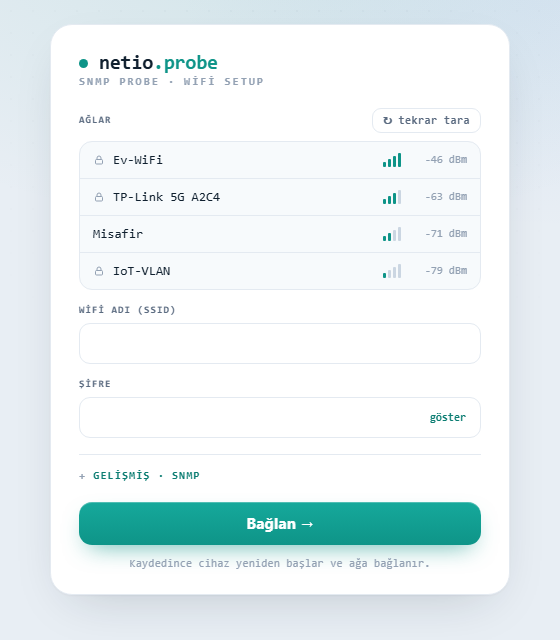
After that, you can reach the web interface with the DHCP IP address or with mDNS:
http://netio-probe-<chipid>.local/The dashboard looks like this:
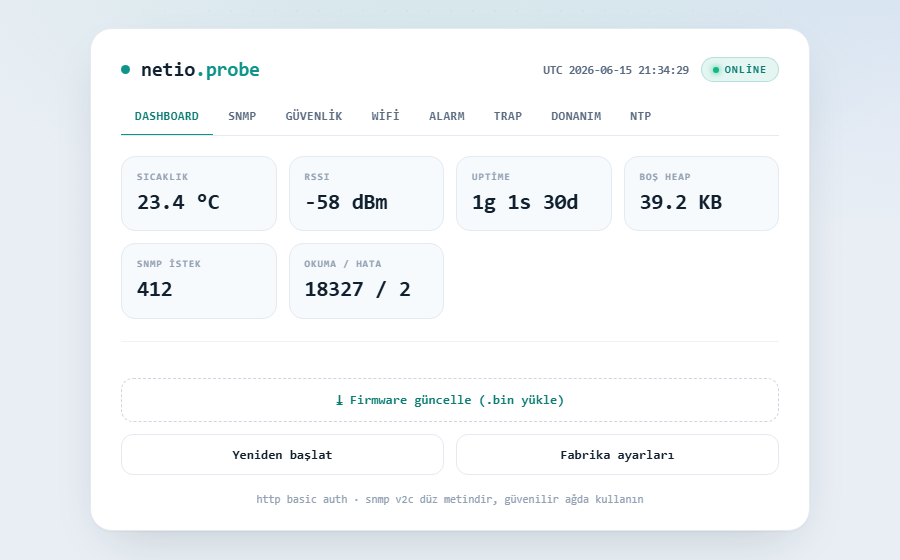
Check the monitoring interfaces
After the device is on the network, we can test SNMP.
Basic SNMP checks:
snmpget -v2c -c public <ip> .1.3.6.1.2.1.99.1.1.1.4.1snmpget -v2c -c public <ip> .1.3.6.1.4.1.63333.10.1.0snmpwalk -v2c -c public <ip> .1.3.6.1.4.1.63333The first OID uses ENTITY-SENSOR-MIB and returns temperature multiplied by 10. The second one is the enterprise OID and returns temperature multiplied by 1000.
The main interfaces:
| Interface | Transport | Notes |
|---|---|---|
| SNMP agent | UDP/161 | Read-only SNMP v2c |
| SNMP traps | UDP/162 | Sent when thresholds change |
| Prometheus metrics | HTTP /metrics | Temperature, RSSI, heap, counters |
| Syslog | UDP/514 | RFC 5424 |
| Web UI | HTTP/80 | Config and status |
Some useful enterprise OIDs under .1.3.6.1.4.1.63333.10:
| OID suffix | Value |
|---|---|
1 | Temperature x1000 |
2 | Free heap |
3 | RSSI |
4 | Uptime |
5 | Sensor read count |
6 | Sensor error count |
7 | SNMP request count |
8 | Alarm state |
9 | Low threshold |
10 | High threshold |
Conclusion
This was a really cool project. You get a cheap network temperature probe that speaks SNMP, syslog, and HTTP. You can use it for monitoring your server room, your home, or even outdoors if you put it in a waterproof enclosure. The SNMP traps can be used to trigger alerts when the temperature goes too high or too low. The metrics can be scraped by your monitoring system for graphing and alerting. The syslog messages can be collected by your log management system for historical analysis.